Help
How to obtain predictions
This website provides access to predictions of peptide binding to Macaque MHC class I molecules. To obtain predictions, first specify a sequence using the standard single letter amino acid code. Then, select for which Macaque allele you want to make binding predictions for, or choose "All Alleles". Next, specify if you are only interested in peptides of a specific length between eight and eleven amino acids or if predictions should be made for all those lengths. For the display of results, you can specify a sorting order and a cutoff limiting the displayed results to peptides with predicted IC50 values below that cutoff. Using such a cutoff is strongly recommended if the protein sequence(s) contain a total of more than 1000 amino acids, as transferring these results can otherwise take a long time.
As an example, take the first 50 residues of the TAT protein sequence of the SIV virus:
METPLREQENSLESSNERSSCILEADATTPESANLGEEILSQLYRPLEAC
Paste this sequence into the first form field in the prediction page and click submit on the bottom. If the rest of the form is left on the default settings, this will generate predictions of binding to Mamu-A01 for all 8-mer peptides contained in the protein sequence. The output should look like this:
SAMPLE TABLE
Each row in the table corresponds to one peptide binding prediction. The rows can be sorted by peptide position in the protein, peptide length, peptide sequence, MHC allele the prediction is made for, and predicted affinity, by clicking on the corresponding table column headers. If nothing happens when clicking on a column header, JavaScript is probably turned off in your browser. JavaScript has to be turned on for interactive sorting of the results table, but is not needed elsewhere.
| Allele | Seq:Start-End | Length | Sequence | IC50 [nM] |
| A01 | 1: 1-8 | 8 | ARSTSRRT | 1768555.3 |
| A01 | 2: 1-8 | 8 | TRSSFRGS | 45372076.2 |
| A02 | 1: 1-8 | 8 | ARSTSRRT | 1280324.0 |
| A02 | 2: 1-8 | 8 | TRSSFRGS | 1862192.2 |
| A11 | 1: 1-8 | 8 | ARSTSRRT | 280127.0 |
| A11 | 2: 1-8 | 8 | TRSSFRGS | 2261529.6 |
| B01 | 1: 1-8 | 8 | ARSTSRRT | 34730777.8 |
| B01 | 2: 1-8 | 8 | TRSSFRGS | 149491295.5 |
| B17 | 1: 1-8 | 8 | ARSTSRRT | 1342405.9 |
| B17 | 2: 1-8 | 8 | TRSSFRGS | 853807.1 |
How to interpret predictions
In the following it is assumed that the predictions are used to identify peptides that are likely to be T-cell epitopes. Unfortunately, there is no one correct way to decide which peptides should be picked. Instead, the cost associated with increasing the number of experiments (=number of peptides) has to be weighed against the cost associated with missing a certain fraction of epitopes. The figure below is meant to help in this decision. Panel A depicts the number of peptides in the SIV proteome predicted to bind at a given affinity (gray curve) and the number of known SIV epitopes predicted at a given affinity (black curve). Panel B shows the same data but normalized to the total number of peptides (51738 ) and epitopes (59). peptides
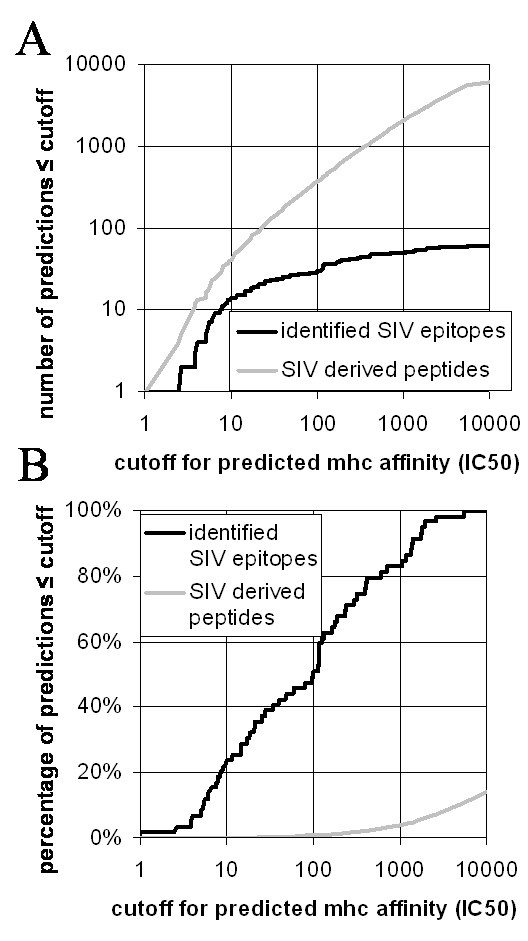
Assuming that the known SIV epitopes are a representative sample of T-cell epitopes in Macaques in general, Figure 1 can be used to decide what cutoff for the predicted affinity should be chosen. Taking the predictions made in the table above as an example, one could decide to select all peptides with IC50 < 1000nM, which in this case is just peptide TTPESANL (predicted IC50=5.1nM). From Figure 1 it can be inferred that 80% of known epitopes have an IC50 value below that threshold. Alternatively, one could choose all peptides with predicted affinities below 10000 nM. This cutoff covers all known epitopes, and in the above example would mean including peptide LSQLYRPL (predicted I50 = 1462 nM).
Of course, the numbers above rely on several assumptions, most importantly that the set of SIV epitopes is a representative sample of antigenicity as a whole. Therefore, these estimates should only serve as a first guideline for study design and have to be re-evaluated as experimental data becomes available.